Effect Size Measures
Effect Size Measures
Overview
Effect size is a quantitative measure of the magnitude of a phenomenon. Unlike p-values, which indicate the probability of observing data given the null hypothesis, effect sizes indicate the practical significance of the result, independent of sample size.
1. Distinction from Statistical Significance
Statistical significance (p-value) conflates the magnitude of the effect with the sample size.
- Large Sample: Trivial differences can become statistically significant.
- Small Sample: Meaningful differences may fail to reach statistical significance (Type II error).
Effect size provides a standardized metric to evaluate the strength of the relationship.
2. Common Measures
Comparison of Means
| Measure | Application | Formula |
|---|---|---|
| Cohen's d | Two independent groups (standardized difference). | |
| Hedges' g | Correction of Cohen's d for small samples. | -- |
| Glass's |
Used when standard deviations differ substantially. | Uses control group SD. |
Measures of Association (Correlation)
| Measure | Application | Interpretation |
|---|---|---|
| Pearson's r | Linear relationship strength. | |
| Spearman's |
Monotonic relationship strength. | Rank-based association. |
Variance Explained (ANOVA)
| Measure | Application | Note |
|---|---|---|
| Eta-squared ( |
Proportion of total variance explained. | Biased (overestimates). |
| Omega-squared ( |
Less biased estimate of population variance. | Preferred for reporting. |
Categorical Data
| Measure | Application |
|---|---|
| Odds Ratio (OR) | Probability of event occurring in one group vs another. |
| Relative Risk (RR) | Ratio of probabilities. |
| Cramér's V | Strength of association for Chi-square tests. |
3. Cohen's d Guidelines
Cohen (1988) provided heuristics for interpreting effect sizes in behavioral sciences.
| Effect Size | d | Interpretation |
|---|---|---|
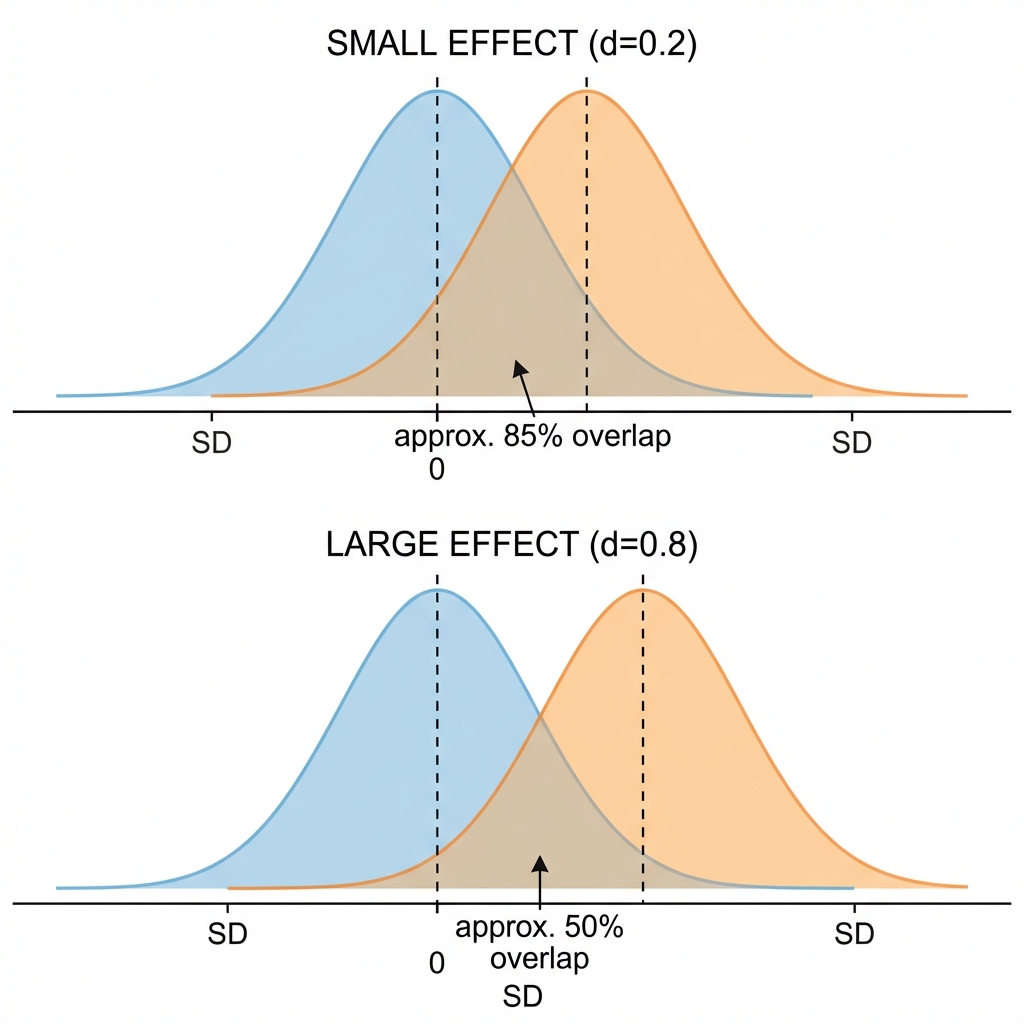
| Small | 0.2 | Distributions overlap significantly; difficult to detect without statistical analysis. |
| Medium | 0.5 | Difference is likely visible to the naked eye. |
| Large | 0.8 | Substantial difference; minimal overlap. |
4. Conversion Formulas
Effect sizes can often be converted between metrics.
d to r:
r to d:
5. Python Implementation Example
import numpy as np
from scipy import stats

def cohens_d(group1, group2):
    n1, n2 = len(group1), len(group2)
    var1, var2 = np.var(group1, ddof=1), np.var(group2, ddof=1)

    # Pooled Standard Deviation
    s_pooled = np.sqrt(((n1 - 1) * var1 + (n2 - 1) * var2) / (n1 + n2 - 2))

    # Calculate d
    d = (np.mean(group1) - np.mean(group2)) / s_pooled
    return d

# Example Usage
np.random.seed(42)
control = np.random.normal(100, 15, 50)
treatment = np.random.normal(108, 15, 50)

d = cohens_d(treatment, control)
print(f"Cohen's d: {d:.3f}")

# Hedges' g correction
n = len(control) + len(treatment)
g = d * (1 - (3 / (4 * n - 9)))
print(f"Hedges' g: {g:.3f}")
6. Reporting Standards
It is standard academic practice to report effect sizes alongside p-values and confidence intervals.
"The treatment group demonstrated significantly higher scores than the control group (
), indicating a medium effect size."
7. Related Concepts
- Student's T-Test - Statistical test associated with Cohen's d.
- One-Way ANOVA - Associated with
and . - Pearson Correlation - Associated with
and . - Binary Logistic Regression - Associated with Odds Ratio.