Leverage (Hat Matrix)
Leverage (Hat Matrix)
Overview
Leverage (
1. Mathematical Derivation
In OLS regression (
The
The diagonal elements
2. Properties
- Bounds:
. - Sum:
(number of parameters including intercept). - Mean Leverage:
.
3. Identification Thresholds
A common rule of thumb identifies a point as high leverage if:
Points exceeding
4. Worked Example: The Outlier CEO
You are modeling Income vs Age for a small town.
- Most people (
) are aged 20-60, earning $30k-$100k. - Person X (CEO): Age = 95, Income = $50,000.
Question: Does Person X have high leverage? Is it influential?
Analysis:
-
Check X-Space (Age):
- Mean Age
. - Person X Age = 95. This is far from the centroid.
- Result: High Leverage (
will be large).
- Mean Age
-
Check Y-Space (Residual):
- If the model predicts Income for a 95-year-old is roughly $40k-$60k (retirement), and actual is $50k...
- Residual is small.
-
Conclusion:
- Person X is a High Leverage point (extreme Age).
- However, because the income fits the trend, it is Low Influence. It merely anchors the regression line, reducing standard errors (Good Leverage).
- Contrast: If the CEO earned $10M, they would be High Leverage AND High Influence (pulling the slope up).
5. Assumptions
6. Limitations
- Good vs Bad Leverage: Don't delete points just because they have high leverage! If they follow the trend, they are valuable data points that increase precision. Only remove if they are errors or fundamentally different populations.
- The "Masking" Effect: Two high-leverage points close to each other can mask each other's influence.
- Data Entry Errors: High leverage often flags typos (e.g., Age=950 instead of 95). Always check source data.
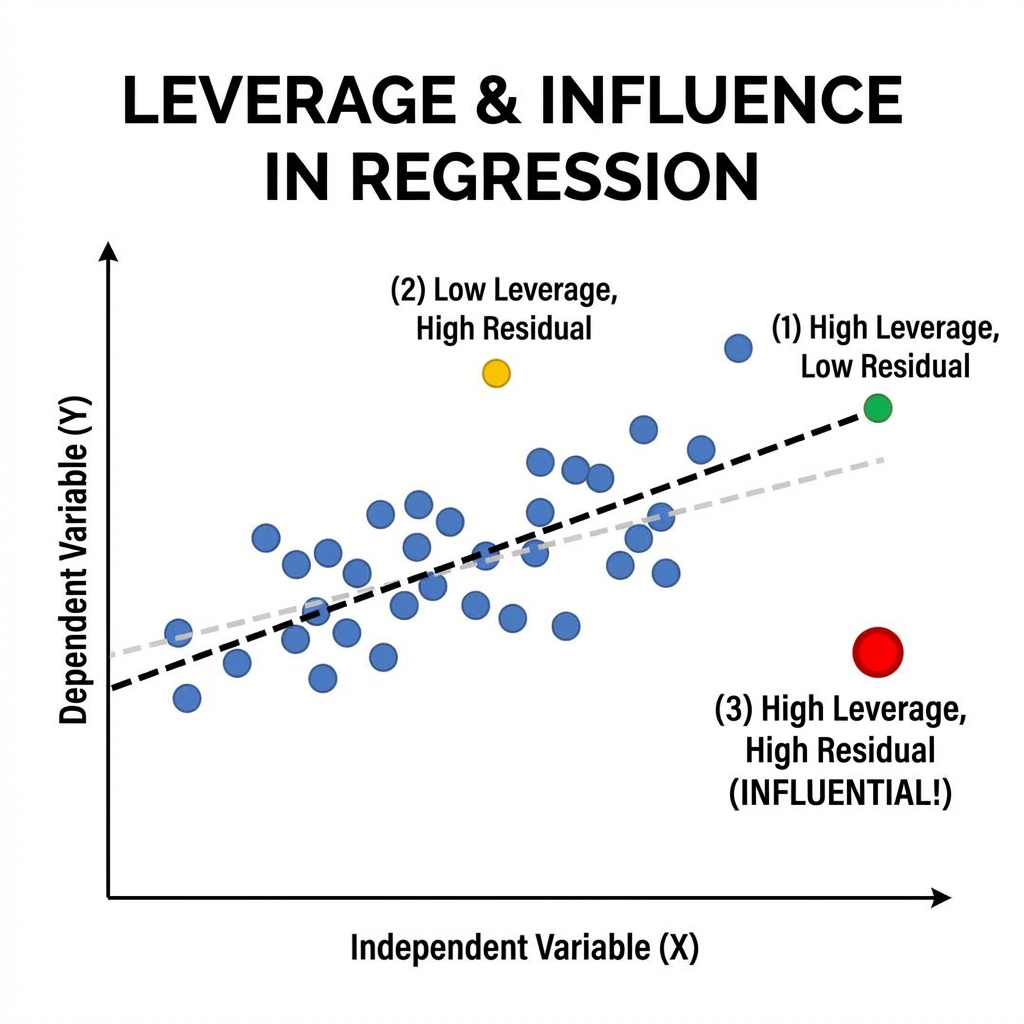
7. Leverage vs. Influence
High leverage is a necessary but insufficient condition for high influence.
- Good Leverage: A point follows the trend of the rest of the data but is extreme in X. It reduces the standard error of estimates.
- Bad Leverage: A point is extreme in X and deviates from the trend (large residual). This pulls the regression line towards itself.
See Cook's Distance for the combined measure of Influence.
Interpretation Guide
| Metric | Rule of Thumb | Action |
|---|---|---|
| Moderate Leverage | Investigate. Check for data entry errors. | |
| Result is High Leverage | Danger zone. Check Cook's Distance to see if it's influential. | |
| Minimum possible leverage | Perfectly average observation X-wise. | |
| 1.0 | Maximum possible leverage | Parameter is determined solely by this point (DF used up). |
8. Python Implementation Example
import numpy as np
import statsmodels.api as sm

# Fit Model
model = sm.OLS(y, X).fit()

# Get Influence
influence = model.get_influence()
leverage = influence.hat_matrix_diag

# Threshold
p = len(model.params)
n = len(y)
threshold = 2 * p / n

high_leverage_points = np.where(leverage > threshold)[0]
print(f"High Leverage Indices: {high_leverage_points}")
6. Related Concepts
- Cook's Distance - Measure of influence combining leverage and residuals.
- Outlier Analysis (Standardized Residuals) - Outliers in Y-space.
- Multiple Linear Regression - Framework.